Are some neighborhoods hotter than others?
Published:
Delving into urban heat islands
Summer this year has seemingly been unusually hot (but do we not say this every year?). To investigate, I decided to dive into the data. Given the extreme heat of the past few weeks, I wanted to know does temperature get measured across a city? But also, what could possibly affect micro-level weather changes within the same urban area? For instance, why do some areas of the city feel more humid or even cooler than others?
It turns out, these pocket of higher-than-average temperatures are called heat islands. Heat islands are smaller spaces within a city which are hotter than the average temperature of the rest of it. In these areas, building materials like concrete or brick retain more heat than natural structures like parks or trees. As we replace more green spaces with pavement or steel and concrete structures, urban heat islands become a more pertinent issue.
🗺 Mapping Urban Heat
I was curious to see how these island patterns show up between different cities so I went looking for data. This cool Urban Heat Hot Spots dataset by Climate Central contains Urban Heat Index information for 44 US cities. The Index is an estimated measure of heat in an area and it’s calculated through built environment (land cover types, building heights) and other metrics, like population density.
Importantly, the dataset’s methodology identifies a surface’s albedo as the most important contributor of the UHI. Albedo measures how much any surface reflects the sun’s radiation. Low albedo surfaces emit sun radiation back as heat (concrete, some water bodies) making UHI higher.
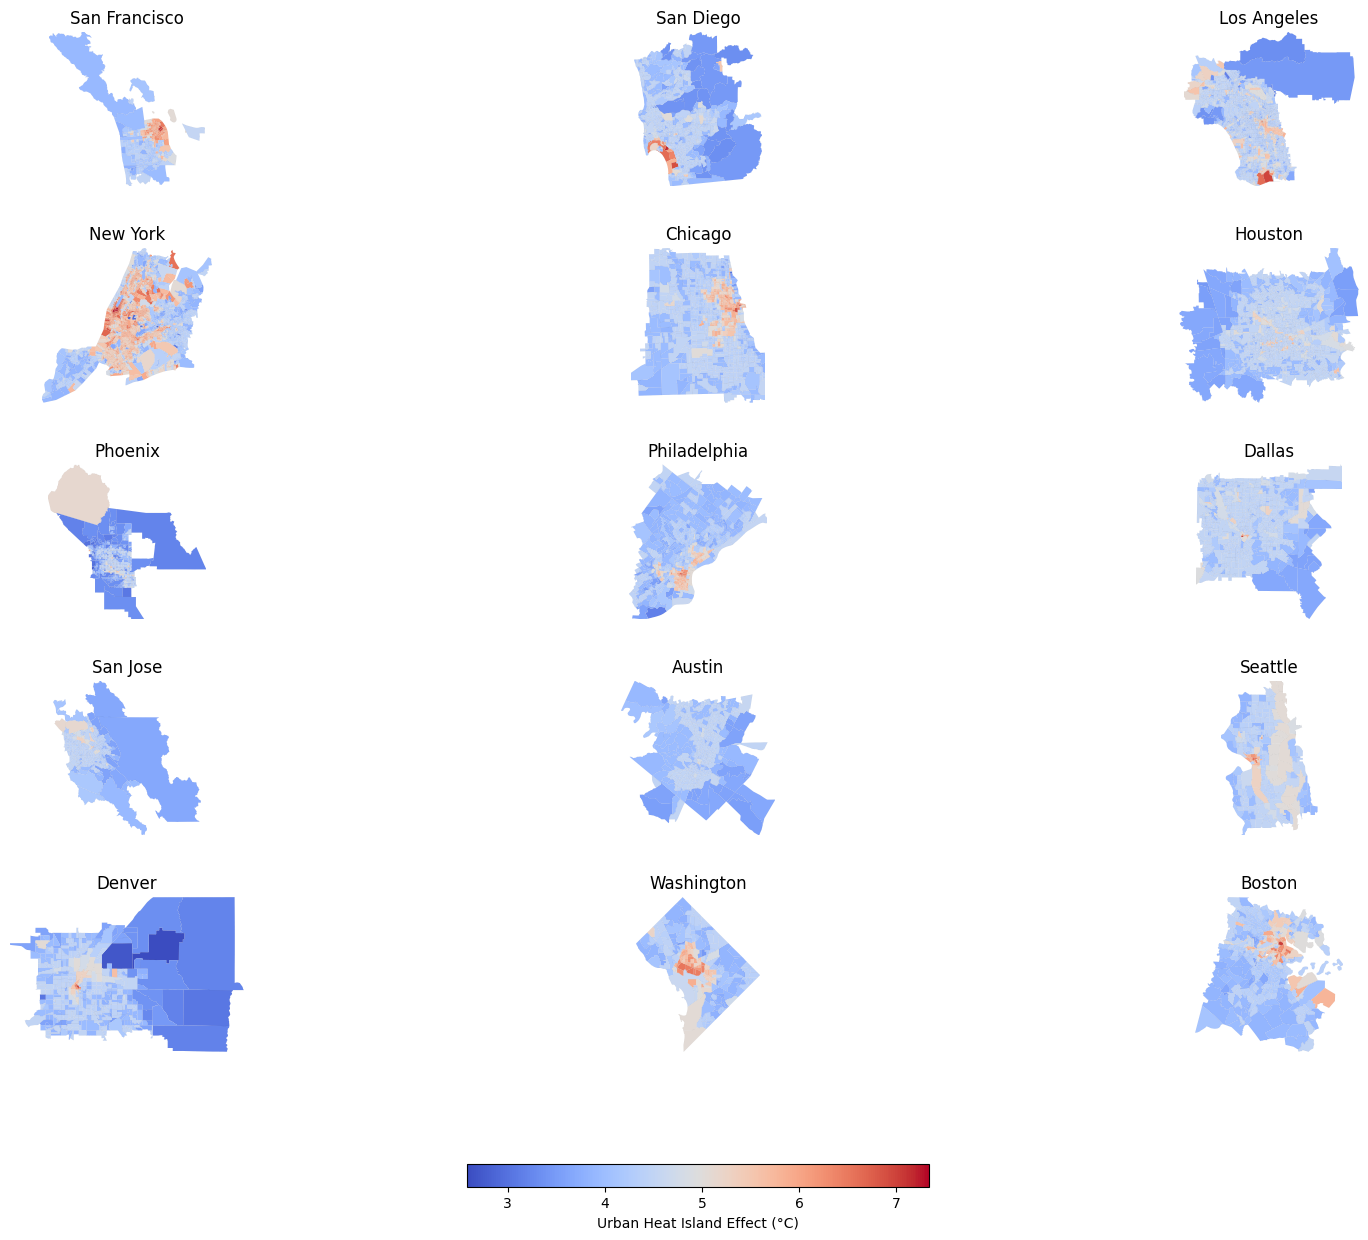
Using the census tract information along with Python’s pygris and censusdata packages, I made this map showing which parts of the largest US cities have higher heat levels:

Immediately you can see the downtown areas popping up in each city and the more suburban zones having relatively lower UHI indices. For instance, New York in particular seems to have more ‘sprawling’ heat zones all across it where other cities are have islands that are concentrated around the downtown core.
In fact, Climate Central identifies 3 types of these configurations:
- Sprawling heat pattern (e.g., NYC, DC, Seattle): These cities have heat islands spread out across large urban areas, often overlapping with multiple neighborhoods.
- Diffuse heat (e.g., Boston, Chicago): Here, heat islands are scattered but not as widespread as in sprawling patterns, indicating pockets of high heat surrounded by cooler areas.
- Concentrated heat (e.g., San Diego, San Jose): These cities have heat islands primarily around the central downtown areas, with outer areas being significantly cooler.
It’s interesting to think about these differences in terms of how each city developed over time. NYC is a big urban center, which might account for its UHI patterns, but places like Boston and Chicago have followed different urbanization trajectories, which makes their heat distribution different.
🌡 How many people are affected by heat islands?
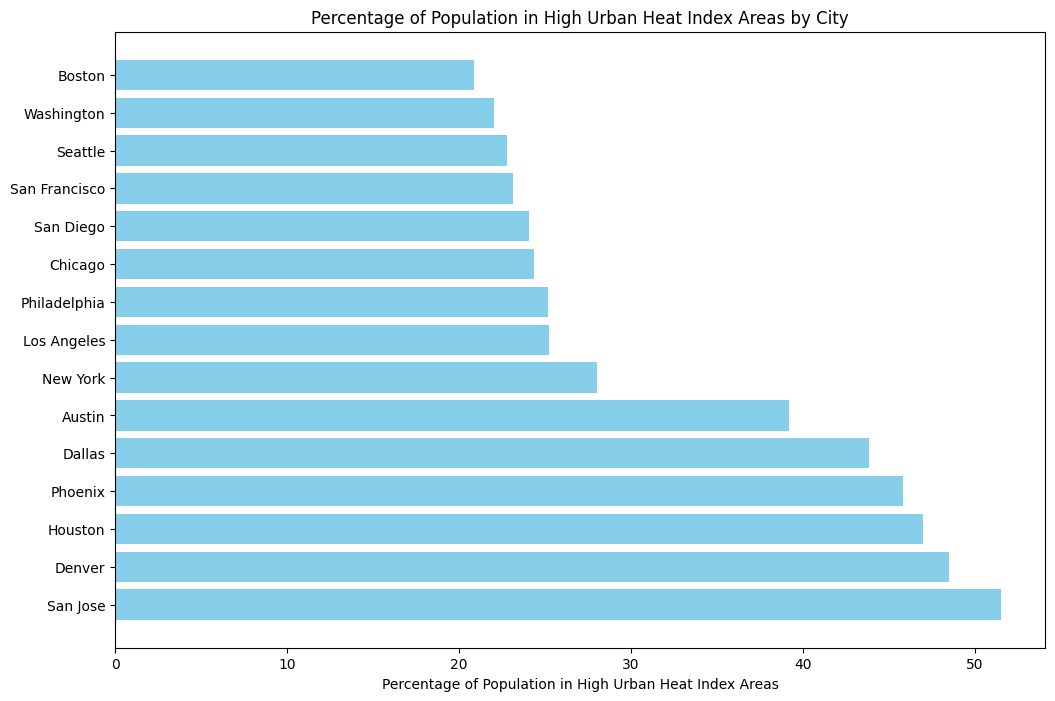
Let’s look at this information from a different lens. Specifically, how much of each city’s population lives in one of these heat islands? Again with censusdata to the rescue, here’s the percent of population who lives in a UHI area of 75th percentile or higher:

It’s interesting to note the big jump between New York and cities after Austin, which could also hint at built-environment differences in these areas. It’s possible places like Phoenix or Houston have fewer green spaces and more concrete and glass structures that contribute to these numbers. (Note: these cities also have hotter weather in general compared to somewhere like Seattle or San Francisco, which likely accounts for some of the differences.)
This analysis opens up many intriguing questions:
- Economic Impact: How does living in a heat island affect the economic productivity and energy costs for residents? Are there noticeable differences in energy consumption patterns? Health Implications: Are there higher incidences of heat-related illnesses in areas identified as heat islands? How do hospitals and clinics in these regions prepare for and respond to heat waves?
- Infrastructure and Planning: What are the infrastructure strategies employed by cities with concentrated vs. sprawling heat patterns to mitigate urban heat? How effective are green roofs, urban forests, and reflective pavements in reducing UHI effects?
- Climate Resilience: How do different cities plan to adapt to increasing temperatures due to climate change? What are the long-term strategies for making cities more resilient to heat waves?
These questions can guide further research and policy discussions on creating more livable and resilient urban environments. Let’s dive into the data and see what stories it tells us!
And finally, here’s the code for this analysis.
