Urban Sustainability: World Cities, Parks and Access
Published:
How do world cities compare in their urban sustainability?
Question: How can data science be used in helping us understand developing cities better?
Data science is an interdisciplinary field, with most of its applications still undeveloped. One of the areas data science can help improve is urban planning and development. For instance, I have always been interested in the concept of “smart cities”, or cities engineered to be as efficient as possible. In this tutorial, we are going to look at Tirana, Albania’s capital and also my home city. Now, Tirana is far from fitting the description of a “smart city” — in fact, Tirana is very much a capital of a developing country: bustling, messy and energetic. Through talking to others in the city, one complaint I hear the most is that the city is overcrowded: there is too much traffic, too many buildings and too little green and recreational spaces. So I thought, can we use data science to look at this statement more closely? Let’s get started!
First, some points to guide the process: Does Tirana’s population density rank very high on the list of world cities? Does Tirana have a lack of green spaces (i.e. not enough for each person living in it)?
Let’s look at the population counts and densities for Tirana. For this part, I am going to use GeoJSON data from opendata.tirana.al. The urban part of Tirana is divided into 11 administrative areas, each with a different area and population number: “states” is a GeoPandas dataframe showing each of the areas, together with their corresponding symmetries, and “pa” shows 2020 populations for each area.


Now, let’s look at the densities for each of these areas by using the population divided by the surface area like so: first, we create a dataframe that has population and surface area data for each of the administrative areas. Then, we compute densities, add them as a column, and add the geometry polygons to the dataframe. From there, we plot the dataframe to show densities in different colors:
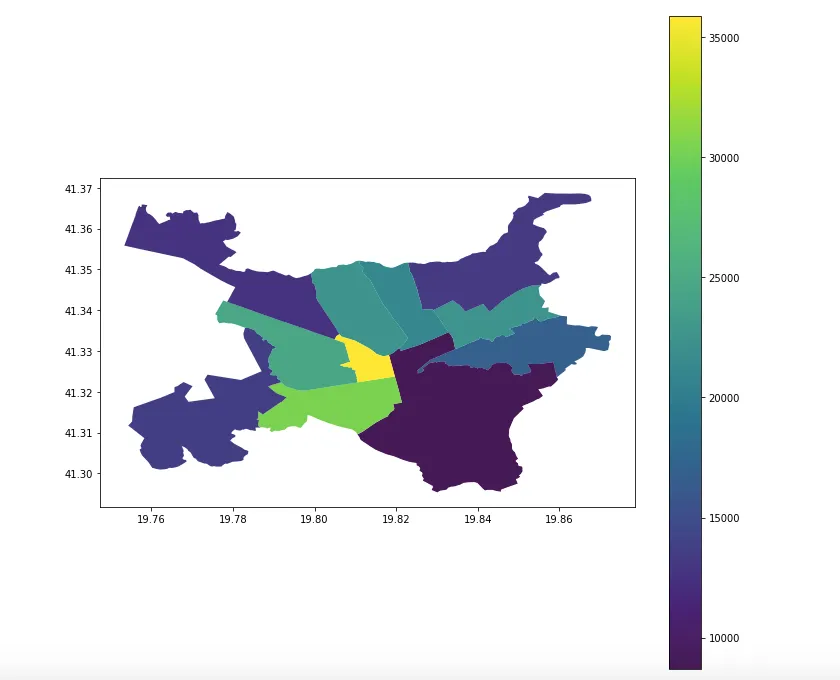
As you can see, the areas have different densities. But what is the mean density and how does it compare to different world cities? Below, you can find a Python calculation returning a mean density of 20229.54889607044, and also a dataset of densities by city, gathered from the United Nations:
Now, let’s plot this dataset using a bar plot with countries in the x-axis and densities on the y-axis:
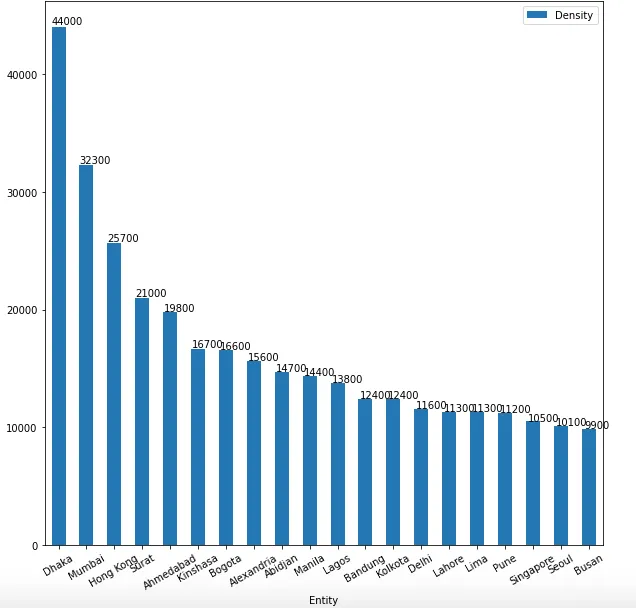
As you can see urban Tirana comes up high on the list (remember that this data is only looking at the urban population, despite the fact that Tirana includes 8 rural areas).
Now, let’s look at Tirana’s green spaces. To answer the question of whether there are enough of them or not, we first need to visualize and plot the data similarly to the polygons in the section above. I couldn’t find any GeoJSON data for Tirana’s parks, so I went to Geojson.io and hand plotted these areas, exporting them to a geojson file. Then, I was able to read the file with geopandas and here is the result:
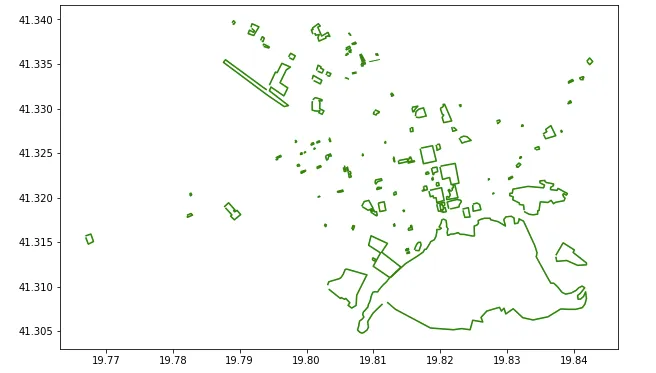
In order to measure how much green space there is, I decided to calculate the area of each of these polygons using shapely. Basically, the coords list contains all of the geometries of the green spaces but in radian form and then area_greens calculates the areas of each element in coords in kilometres square.
If we sum up the areas, they give about 4.078872815753409 kilometres square. The total area of urban Tirana is 41.8 kilometres square. Therefore, Tirana has about 10% green spaces. To put this into context, how does it compare to other world cities? Well, looking at the sorted dataset below, Tirana’s figure ranks most similar to Paris (surprising!) and Buenos Aires.

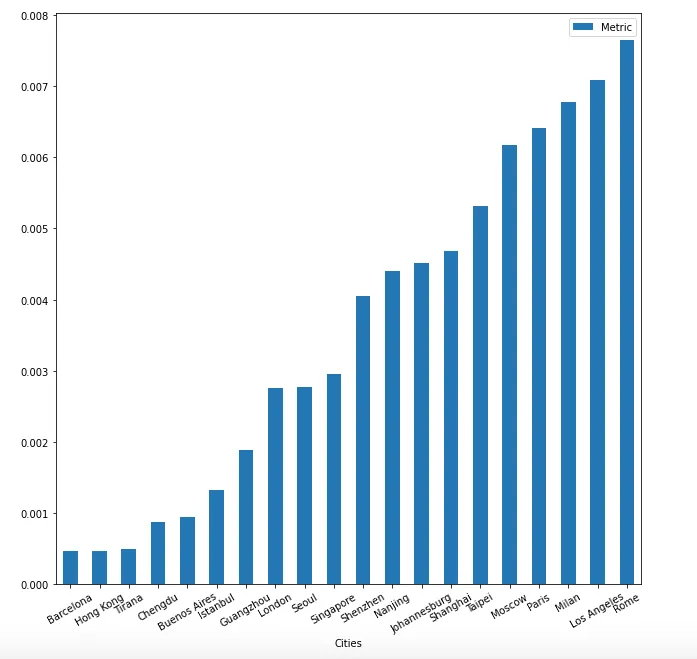
Now that we know how Tirana compares to other cities, how do we decide if there is enough green space for each of its occupants? To answer this, we need to have some kind of a metric that takes into account the proportion of green spaces, as well as the density. How about the green space proportion divided by the population density? To interpret this, we can think of large values to mean that there are more green spaces available for people and smaller values meaning less spaces available. The cell below makes this calculation for Tirana and the other cities in the dataset, and then plots the results:
Conclusions:
As we saw in this short tutorial, Tirana does in fact seem to be relatively overpopulated compared to other world cities. In addition, its residents are probably right in thinking that the city lacks green spaces, coming up pretty low on the list for both the proportion and proportion/density.
